
Prometheus vs Grafana: What's the Difference?
Prometheus collects metrics; Grafana visualizes them. A neutral, sourced guide to what each does, where they overlap on alerting, and which to install first.

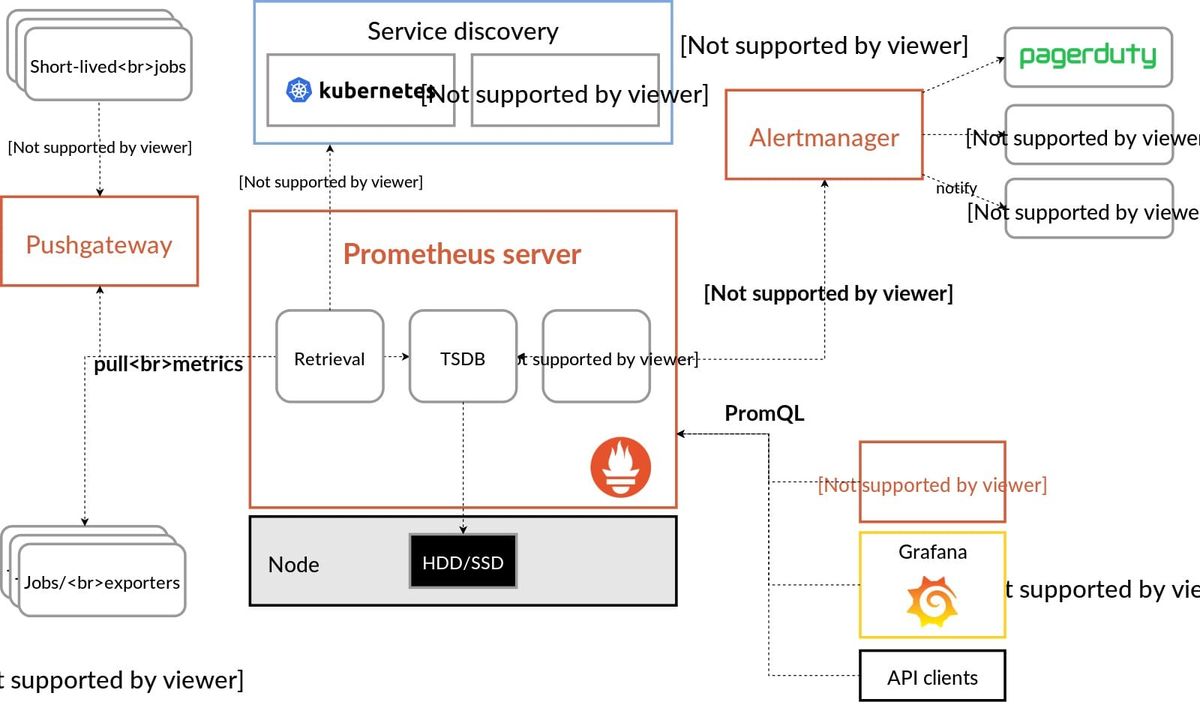
TL;DR
- Prometheus and Grafana are not competitors. Prometheus collects, stores and alerts on metrics. Grafana draws them. Most production stacks run both.
- Install Prometheus first. It produces the data. Grafana has shipped a built-in Prometheus data source since Grafana 2.5.0 (28 October 2015).
- Current versions: Prometheus 3.15.0 (25 September 2026) and Grafana 13.2.3 (29 September 2026).
- The one real overlap is alerting. Grafana Alerting and Prometheus Alertmanager both route notifications. Pick one as the owner — running both uncoordinated is how you get duplicate pages.
- Licences differ and it matters: Prometheus is Apache 2.0, Grafana has been AGPLv3 since April 2021.
Prometheus and Grafana are not competitors. Prometheus scrapes, stores and alerts on time-series metrics, and answers queries in PromQL. Grafana is a visualization layer that queries data sources — Prometheus most often — and renders dashboards. You install Prometheus first because it produces the data. Grafana without a data source shows nothing.
Why almost every other result for this query is written by a competitor
Worth knowing before you read any comparison, including the ones ranking above this one.
Of the ten results currently on page one for this query, five are blog posts published by observability vendors — Edge Delta, Dash0, Sawmills, Mezmo and Last9 — each of which sells a commercial platform that competes with a self-hosted Prometheus and Grafana stack. Two more are the projects' own documentation, which have the opposite bias.
That leaves a seven-year-old Reddit thread and a video. We have no product in this category, so here is the plain version.
The giveaway that the premise is wrong is sitting at positions 2 and 9 of that same results page: both are official docs explaining how to use Prometheus and Grafana together. Prometheus' own visualization documentation tells you its built-in expression browser is "primarily useful for ad-hoc queries and debugging" and points you at Grafana for graphs.
What does Prometheus actually do?
Prometheus is a metrics database with a scraper and an alerting engine attached. Four jobs:
- Scrape metrics over HTTP from targets it discovers (Kubernetes, EC2, Consul, static config).
- Store them in a local time-series database on disk.
- Query them with PromQL, its own query language.
- Evaluate rules — recording rules that precompute expressions, and alerting rules that fire alerts.
It was built at SoundCloud in 2012 and joined the CNCF in 2016 as the second hosted project after Kubernetes. Licence: Apache 2.0.
What it does badly: dashboards. Prometheus ships a web UI for ad-hoc queries and single graphs. It is not a dashboarding product and does not try to be.
It also does not do long-term storage well. Default retention is 15 days, and the Prometheus storage docs are blunt that local storage "is not clustered or replicated" and so is "not arbitrarily scalable or durable in the face of drive or node outages."
What does Grafana actually do?
Grafana queries other systems and draws the results. It stores no metrics of its own.
You point it at a data source, write a query in that source's language, and build panels. Grafana ships roughly 19 core data sources — Prometheus, Loki, Elasticsearch, Tempo, PostgreSQL, CloudWatch and others — plus hundreds more through its plugin catalogue.
Three things it does beyond charting:
- Alerting. Grafana evaluates its own alert rules against any data source and routes notifications.
- Explore and Drilldown. Queryless investigation UIs for metrics, logs and traces, GA since Grafana 12.0 (May 2025).
- Dashboards as code. Git Sync reached general availability in Grafana 13.0 (14 April 2026) and does bidirectional sync with GitHub, GitLab or Bitbucket.
Licence: AGPLv3, relicensed from Apache 2.0 in April 2021.
Prometheus vs Grafana: the differences that matter
| Prometheus | Grafana | |
|---|---|---|
| Category | Metrics collection, storage, alerting | Visualization and dashboarding |
| Stores data? | Yes, local TSDB | No |
| Query language | PromQL (its own) | None of its own; uses each data source's |
| Data sources | Scrapes targets; also accepts OTLP and remote write | ~19 core, hundreds via plugins |
| Dashboards | Basic built-in UI only | Core product |
| Alerting | Alerting rules plus Alertmanager | Grafana Alerting, built into the server |
| Default retention | 15 days local | N/A |
| Licence | Apache 2.0 | AGPLv3 (since April 2021) |
| Latest release | 3.15.0, 25 Sep 2026 | 13.2.3, 29 Sep 2026 |
Grafana Alerting vs Prometheus Alertmanager: which should you use?
Use Grafana Alerting unless you already run Alertmanager, or you need alerts that survive Grafana being down.
Grafana's alert rule documentation recommends Grafana-managed rules "whenever possible". This is the genuine overlap between the two tools, and it causes most of the confusion.
Grafana Alerting is modelled on Prometheus alerting. Grafana ships a built-in Grafana Alertmanager that extends the Prometheus Alertmanager (currently v0.34.1, released 17 September 2026) and handles notifications for Grafana-managed rules.
You have two rule types:
- Grafana-managed rules. Stored in Grafana. Can span multiple data sources in one rule, support expressions, no-data and error states, images in notifications, RBAC, alert state history, and Terraform provisioning.
- Data source-managed rules. Stored in Prometheus, Mimir or Loki. Inside Grafana you can only create and edit these for Mimir and Loki — rules in a plain Prometheus data source are view-only.
The trade-off is straightforward.
Choose Prometheus rules plus Alertmanager if your alerting must keep working when Grafana is unavailable, you want alert rules living in the same Git repo as your Prometheus config, or you run Prometheus in several clusters feeding one Alertmanager.
Choose Grafana Alerting if you alert across more than metrics, want RBAC and alert history, or do not want to run another component.
Do not run both unsupervised. If you already have Alertmanager, Grafana can forward its own alerts into it so notification policies, silences and mute timings stay in one place.
If you are weighing the self-hosted stack against a commercial platform instead, our Grafana vs Datadog cost breakdown models what each actually costs at 40 hosts.
What changed recently in Prometheus and Grafana?
Prometheus 3.0 landed on 14 November 2024 — the first major version in seven years. Per the Prometheus changelog, the headline changes:
- A completely new web UI, with a tree view and an "Explain" tab.
- UTF-8 metric and label names on by default. The
utf8-namefeature flag was removed. - An OTLP receiver, enabled with
--web.enable-otlp-receiverrather than a feature flag.
Two things people get wrong about the 3.x line:
- Native histograms are stable. They became a stable, opt-in feature in 3.8.0 (2 December 2025), and in 3.9.0 (7 January 2026) the
native-histogramfeature flag became a no-op. You enable them with thescrape_native_histogramsconfig setting. - Remote Write 2.0 is still labelled experimental in the spec, even though Prometheus has shipped receiving and sending support for it. Prometheus 3.8.0 updated receiving to the 2.0-rc.4 spec.
Grafana 12.0 (5 May 2025) brought the new dashboard schema, Drilldown GA, Git Sync in preview, and GA for Grafana-managed alerts and recording rules.
Grafana 13.0 (14 April 2026) made dynamic dashboards generally available and on by default, according to Grafana's v13.0 release notes. Existing dashboards migrate to the new schema when you open them, with no manual step — and the migration is one-way. Git Sync went GA in the same release, and the feature toggle that let you disable the Scenes-based architecture was removed.
What about long-term storage: Mimir, Thanos or Cortex?
All three are alive, and you need one of them only once a single Prometheus server stops being enough.
- Grafana Mimir — latest
mimir-3.2.1, 10 September 2026. AGPLv3. - Thanos — latest
v0.42.4, 30 July 2026. Apache 2.0. - Cortex — latest
v1.21.1, 5 June 2026, still actively developed under the CNCF. Apache 2.0.
If licence terms constrain you, Thanos and Cortex are Apache 2.0 while Mimir is AGPLv3 like Grafana itself.
If you are running one Prometheus and retention under a few months, skip all three. Raise --storage.tsdb.retention.time and move on.
Does the licence difference actually matter?
For most teams, no. For some, a lot.
Prometheus is Apache 2.0 — permissive, no source-sharing obligation. Grafana is AGPLv3, relicensed on 21 April 2021 alongside Loki and Tempo.
AGPLv3 adds a network clause: if you modify Grafana and make it available to others, including over a network, you must share your source. Running stock Grafana internally triggers nothing. Embedding a modified Grafana in a product you ship or host for customers is where you need legal input.
What this means for you
If you are starting from zero on Kubernetes: install both, via kube-prometheus-stack. You get Prometheus, Alertmanager and Grafana wired together with working dashboards. Do not evaluate them separately.
If you are a solo dev or small team: Prometheus plus Grafana, Grafana Alerting for notifications, default 15-day retention. Skip Mimir and Thanos entirely.
If you run a platform team: Prometheus rules plus Alertmanager for infrastructure alerts that must survive Grafana outages. Grafana Alerting for everything that spans metrics, logs and traces. Pick one Alertmanager as the single notification owner.
If you already have metrics in Datadog, CloudWatch or New Relic: you may need only Grafana. It queries all three. There is no rule that Grafana implies Prometheus. Our Datadog vs Splunk comparison covers how the two largest commercial options price that data, and the observability and APM tool roundup covers the wider field.
If you are tracing LLM calls rather than infrastructure: neither tool is the right starting point. See Langfuse vs LangSmith instead.
If you are shipping Grafana inside a commercial product: read AGPLv3 properly before you modify anything.
Frequently Asked Questions
What's the difference between Prometheus and Grafana?
Prometheus is a metrics system: it scrapes targets, stores time-series data locally, runs PromQL queries, and evaluates alerting rules. Grafana is a visualization tool that queries external data sources and renders dashboards. Prometheus produces data; Grafana displays it. They solve different problems and are routinely used together.
Do you need both Prometheus and Grafana?
Usually yes, but not always. Prometheus without Grafana works for alerting and ad-hoc queries, though its built-in UI is intended for debugging rather than dashboards. Grafana without Prometheus works if your metrics already live elsewhere. Most Kubernetes teams run both because neither covers the other's job.
Can you use Grafana without Prometheus?
Yes. Grafana stores no data itself and ships roughly 19 core data sources, including Loki, Elasticsearch, Tempo, PostgreSQL, MySQL, Graphite, InfluxDB, CloudWatch and Azure Monitor, plus hundreds of plugins. If your metrics already sit in a supported backend, Grafana queries them directly. Prometheus is the most common source, not a requirement.
Is Grafana or Prometheus better for alerting?
Grafana Alerting for most teams — it alerts across any data source, supports multi-source rules, RBAC and alert history, and Grafana's docs recommend it. Choose Prometheus alerting rules plus Alertmanager when alerts must fire even if Grafana is down, or when rules belong in Git beside your Prometheus config.
Editor's note — sources: Version and release-date claims were verified against the GitHub releases API for prometheus/prometheus and grafana/grafana on 2 October 2026: Prometheus v3.15.0 (25 September 2026), Grafana v13.2.3 (29 September 2026), Grafana v13.0.0 tagged 14 April 2026, Prometheus v3.0.0 (14 November 2024), v3.8.0 (2 December 2025) and v3.9.0 (7 January 2026). Alertmanager v0.34.1, Mimir mimir-3.2.1, Thanos v0.42.4 and Cortex v1.21.1 were checked the same way. Retention and expression-browser statements come from the Prometheus documentation; alerting-rule guidance, the v13.0 release notes and the AGPLv3 relicensing announcement come from Grafana Labs. The characterisation of page-one publishers as observability vendors is Edgewisely's own assessment of those companies' products, not a claim made by them.