
Top 7 Load Testing Tools in 2026
We rank the seven best load testing tools for 2026 — Grafana k6, Apache JMeter, Gatling, Locust, BlazeMeter, OpenText LoadRunner and Tricentis NeoLoad — with real pricing, deployment models, and honest pros and cons.


TL;DR
- The practical shortlist of load testing tools for 2026: Grafana k6 (modern, test-as-code, ~31.5k GitHub stars), Apache JMeter (free, protocol-broad, the enterprise baseline), and Gatling (highest-throughput JVM engine). Locust covers Python shops; BlazeMeter, OpenText LoadRunner, and Tricentis NeoLoad cover managed and enterprise needs.
- Free and open source: k6 (AGPL-3.0), JMeter (Apache-2.0), Gatling OSS (Apache-2.0), Locust (MIT). Commercial/quote-only: LoadRunner and NeoLoad publish no pricing; Gatling Enterprise is contact-sales.
- Transparent paid pricing is rare here. k6 starts at $19/mo (Grafana Cloud k6) with a $25,000/yr enterprise minimum; BlazeMeter publishes $149/mo (Basic) and $649/mo (Pro).
- No single winner. Pick by how you write tests (code vs GUI), what you test (HTTP vs SAP/Citrix/mainframe), and whether you run load yourself or buy it as a service.
Load testing tools simulate concurrent users or requests against an application to measure how it behaves under stress — response times, throughput, error rates, and the breaking point. In 2026 the leaders are Grafana k6, Apache JMeter, and Gatling for code-first teams, with Locust, BlazeMeter, OpenText LoadRunner, and Tricentis NeoLoad covering Python, managed-cloud, and heavy enterprise scenarios. The right choice depends on your scripting model and protocol needs, not on raw marketing claims. This guide ranks the best load testing tools on capability, adoption, and fit, with real pricing and honest trade-offs.
How we picked these
We weighed five things: current adoption (GitHub stars, install base, named users), scripting model and developer experience, protocol and deployment breadth, pricing transparency, and maintenance status as of October 2026. We favored tools that are actively released, documented, and used in production. We did not rank on vendor marketing claims, and where a vendor publishes no pricing we say so rather than quote third-party numbers. There is no paid placement in this list.
Quick comparison
| Tool | Best for | Deployment | Pricing model |
|---|---|---|---|
| Grafana k6 | Dev/SRE teams in the Grafana stack | OSS (AGPL-3.0) + SaaS + self-host | Free; Pro $19/mo + usage; Enterprise from $25k/yr |
| Apache JMeter | QA teams wanting a free, GUI, protocol-broad tool | OSS (Apache-2.0), self-host | Free |
| Gatling | High-throughput code-based tests | OSS (Apache-2.0) + Enterprise | OSS free; Enterprise on request |
| Locust | Python-fluent programmable scenarios | OSS (MIT), self-host | Free |
| BlazeMeter | Running OSS scripts at cloud scale | Proprietary SaaS (+ on-prem) | Basic $149/mo, Pro $649/mo |
| OpenText LoadRunner | Enterprise/legacy protocol breadth | Proprietary, self-host + SaaS | Pricing on request |
| Tricentis NeoLoad | Enterprise/SAP codeless + CI/CD | Proprietary SaaS + self-host | Pricing on request |
1. Grafana k6
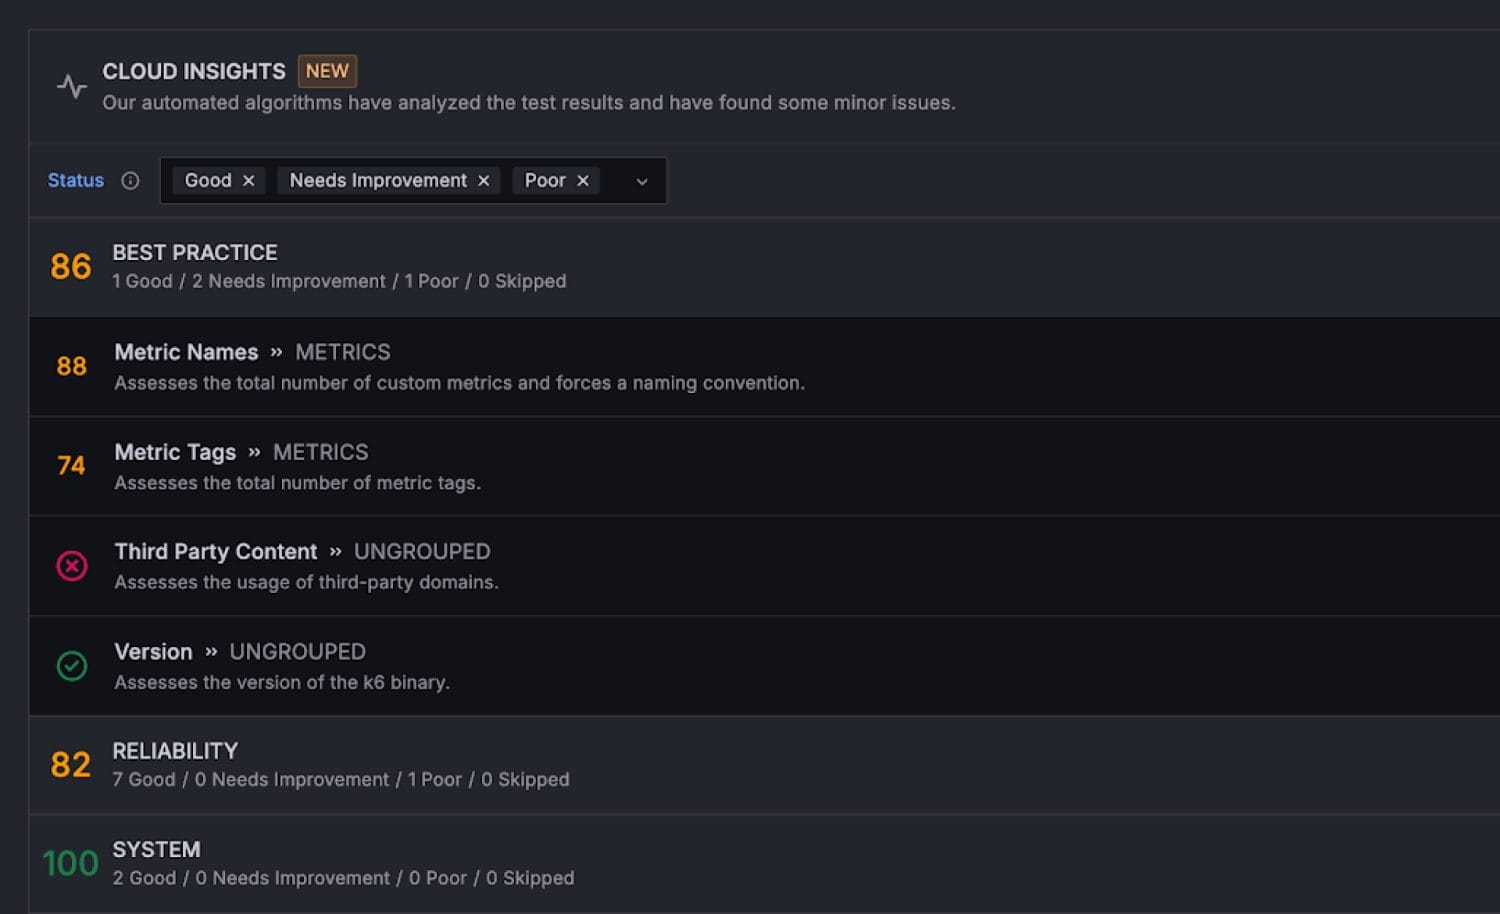
Grafana k6 is the modern developer default for load testing. Its core is written in Go and ships as a single binary, but you write tests in JavaScript (ES6), with first-class TypeScript support since the 1.0 release in May 2025. It handles HTTP/1.1 and HTTP/2, WebSockets, gRPC, and browser-level testing, and extends through xk6 extensions. Distributed runs happen through Grafana Cloud k6 or the self-hosted k6-operator on Kubernetes. Results plug directly into Grafana, Prometheus, and Loki — the main reason teams already in that observability stack reach for it. The CLI-first, test-as-code design fits CI pipelines cleanly.
Best for: Developer and SRE teams that want test-as-code inside the Grafana/Prometheus ecosystem.
Pros
- Scriptable in JavaScript/TypeScript and distributed as a single Go binary — no JVM, trivial to install in CI.
- Native integration with Grafana, Prometheus, and Loki for results visualization.
- Extensible through xk6 (gRPC, SQL, browser, Kafka, and more).
Cons
- No official GUI test recorder in the open-source tool; k6 Studio is a separate project.
- Each virtual user runs a JavaScript runtime, which gets memory-heavy at very high VU counts versus Go-native engines.
- Cloud pricing jumps steeply — the enterprise tier carries a $25,000/yr minimum commit (as of October 2026).
2. Apache JMeter
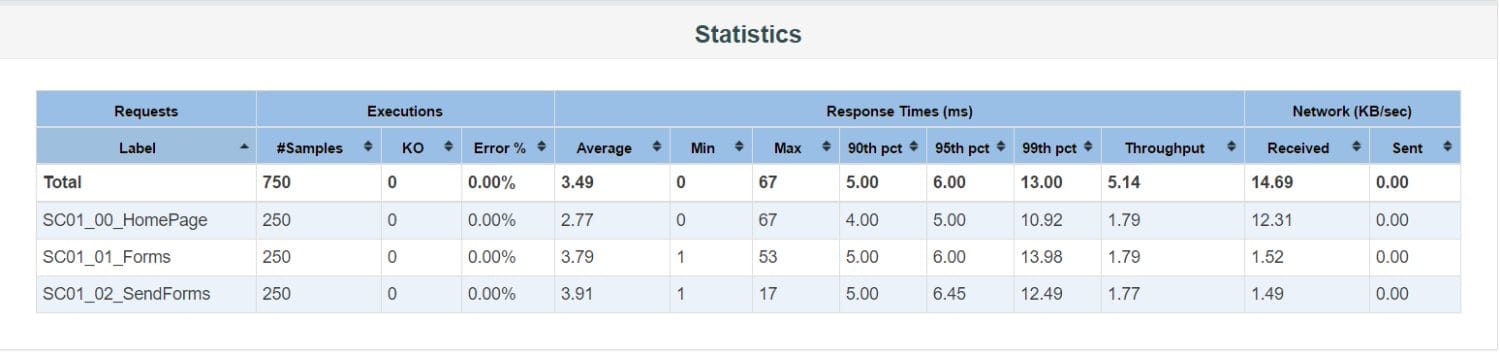
Apache JMeter is the free, open-source incumbent and still the baseline most teams measure others against. It is a pure-Java desktop application with a GUI test-plan builder plus a headless CLI mode you use for real load runs. Its strength is protocol breadth well beyond HTTP: JDBC databases, JMS, LDAP, FTP, SMTP/POP3/IMAP, TCP, and more, all extensible through a large plugin ecosystem. Distributed testing works through a controller plus remote worker nodes. It is maintained by the Apache Software Foundation under the Apache-2.0 license, with the latest release, 5.6.3, shipping in January 2024 — a slower cadence than the code-first tools.
Best for: QA teams that want a free, GUI-driven tool with broad protocol support and no coding mandate.
Pros
- Free, and genuinely protocol-broad (JDBC, JMS, LDAP, FTP) beyond HTTP.
- Full GUI with record-and-playback and HTML dashboard reports — a low barrier for non-coders.
- Huge plugin ecosystem and the deepest community and tutorial base of any tool here.
Cons
- The JVM thread-per-user model is resource-heavy; high concurrency needs distributed setups and strong hardware.
- XML test plans are awkward to diff and version, and the GUI must not be used for actual load runs (CLI only).
- Slow release cadence and a dated interface versus modern code-first tools.
3. Gatling
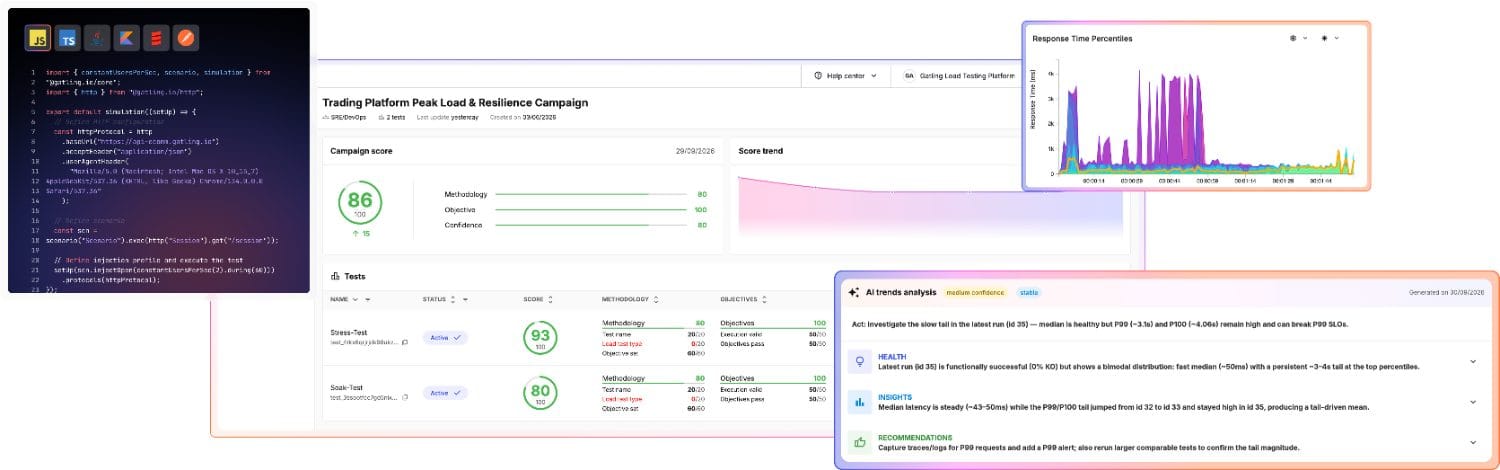
Gatling is the throughput specialist. Its engine is written in Scala and runs on the JVM with an async, non-blocking design, so it sustains many virtual users per thread with modest resource use. You write tests as code through SDKs in Java, Kotlin, Scala, JavaScript, and TypeScript, and it ships an HTTP recorder plus detailed built-in HTML reports. Protocols include HTTP, WebSocket, Server-Sent Events, JMS, gRPC, and MQTT. The open-source engine is Apache-2.0; the commercial Gatling Enterprise edition (formerly FrontLine) adds distributed load generation, real-time dashboards, CI/CD integration, and access controls. The latest OSS release, 3.16, shipped on September 30, 2026.
Best for: Developer teams that need high-throughput, code-based load tests.
Pros
- JVM async engine sustains high throughput with lower resource use than thread-per-user tools.
- Multi-language SDKs (Java, Kotlin, Scala, JavaScript, TypeScript) plus a recorder.
- Detailed HTML reports (percentiles, active users, request/response over time) with no extra setup.
Cons
- Distributed load generation, real-time dashboards, and access controls are paywalled behind Enterprise, which has no public pricing.
- The OSS experience is historically Scala-centric, with a learning curve despite the newer SDKs.
- Smaller community and GitHub following (~7k stars) than k6 or JMeter.
4. Locust
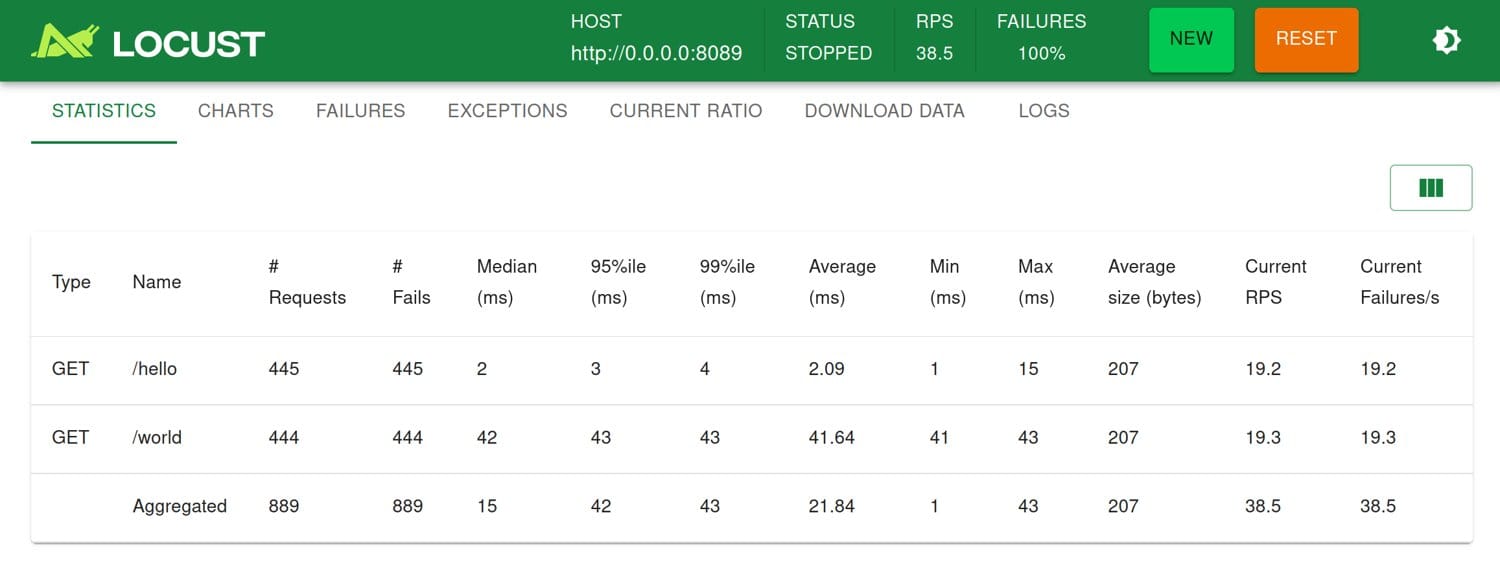
Locust is load testing as plain Python. You define behavior in HttpUser subclasses with @task-decorated methods, which means full language power — conditionals, libraries, and custom logic — in version-controllable code. It uses an event-based model built on gevent greenlets, so one process handles many concurrent users, and it scales horizontally across machines with a master/worker setup. A real-time web UI lets you adjust load mid-run, and a headless mode fits CI. It is MIT-licensed and community-maintained, with no official SaaS. Microsoft is among the users listed in its documentation.
Best for: Python-fluent developers and SREs who want fully programmable scenarios.
Pros
- Tests are real Python, so you get the whole language and easy versioning.
- The gevent model is lightweight and handles high concurrency per node.
- Simple master/worker horizontal scaling plus a live web UI to change load during a run.
Cons
- Python-only, with no GUI test builder — coding ability is required.
- The requests-based HTTP client adds overhead, and each process is single-core, so you run multiple workers to use all cores.
- No official cloud, reporting, or enterprise support — you self-host and self-integrate everything.
5. BlazeMeter
BlazeMeter, owned by Perforce, is a commercial continuous-testing platform whose core trick is running your existing open-source scripts at cloud scale. It executes JMeter, Gatling, Locust, Selenium, and k6 scripts unchanged across geographic regions, and adds its own API testing, functional testing, GenAI test-data generation, service virtualization, and mock services. It is proprietary SaaS, with on-prem load generators available on higher tiers. Unusually for an enterprise tool, it publishes self-serve pricing: Basic at $149/mo (1,000 concurrent users) and Pro at $649/mo (5,000 concurrent users), with an Unleashed enterprise tier that is contact-sales (as of October 2026).
Best for: Teams that want to scale existing JMeter, Gatling, k6, or Selenium scripts in the cloud.
Pros
- Runs existing OSS scripts unchanged at cloud scale — no rewrite.
- Publishes transparent self-serve pricing, which is rare among enterprise testing tools.
- Breadth: load, API, functional, service virtualization, and test data in one platform.
Cons
- Proprietary SaaS with per-VU-hour and test-count limits that get expensive at scale.
- It is an execution and reporting layer, not an engine — you still author tests in the underlying OSS tools.
- The Unleashed and on-prem tiers are quote-only.
6. OpenText LoadRunner
OpenText LoadRunner is the enterprise performance-testing incumbent, and its lineage shows how old that incumbency is: Mercury Interactive to HP in 2006, to Micro Focus in 2017, and to OpenText when it acquired Micro Focus in January 2023. The family spans LoadRunner Professional (single-machine), LoadRunner Enterprise (distributed, formerly Performance Center), LoadRunner Cloud (SaaS), and LoadRunner Developer (code-based). Its defining strength is protocol breadth — 50-plus protocols including Citrix ICA, RDP, SAP GUI, Oracle, .NET, and Java — scripted mainly through VuGen. It can also import JMeter, Gatling, and Selenium scripts. Pricing is quote-only and historically the most expensive option in the category.
Best for: Large enterprises with legacy or complex protocol stacks (SAP, Citrix, Oracle, mainframe).
Pros
- The widest protocol and enterprise-technology coverage of any tool here.
- A mature analysis and correlation engine plus enterprise governance in LoadRunner Enterprise.
- Can ingest JMeter, Gatling, and Selenium scripts through its interface library.
Cons
- Opaque, high, virtual-user-based pricing available only by quote.
- VuGen's C-based scripting is a steep, dated learning curve next to JavaScript or Python tools.
- Heavy, Windows-centric deployment that is not developer- or CI-native the way k6 and Gatling are.
7. Tricentis NeoLoad
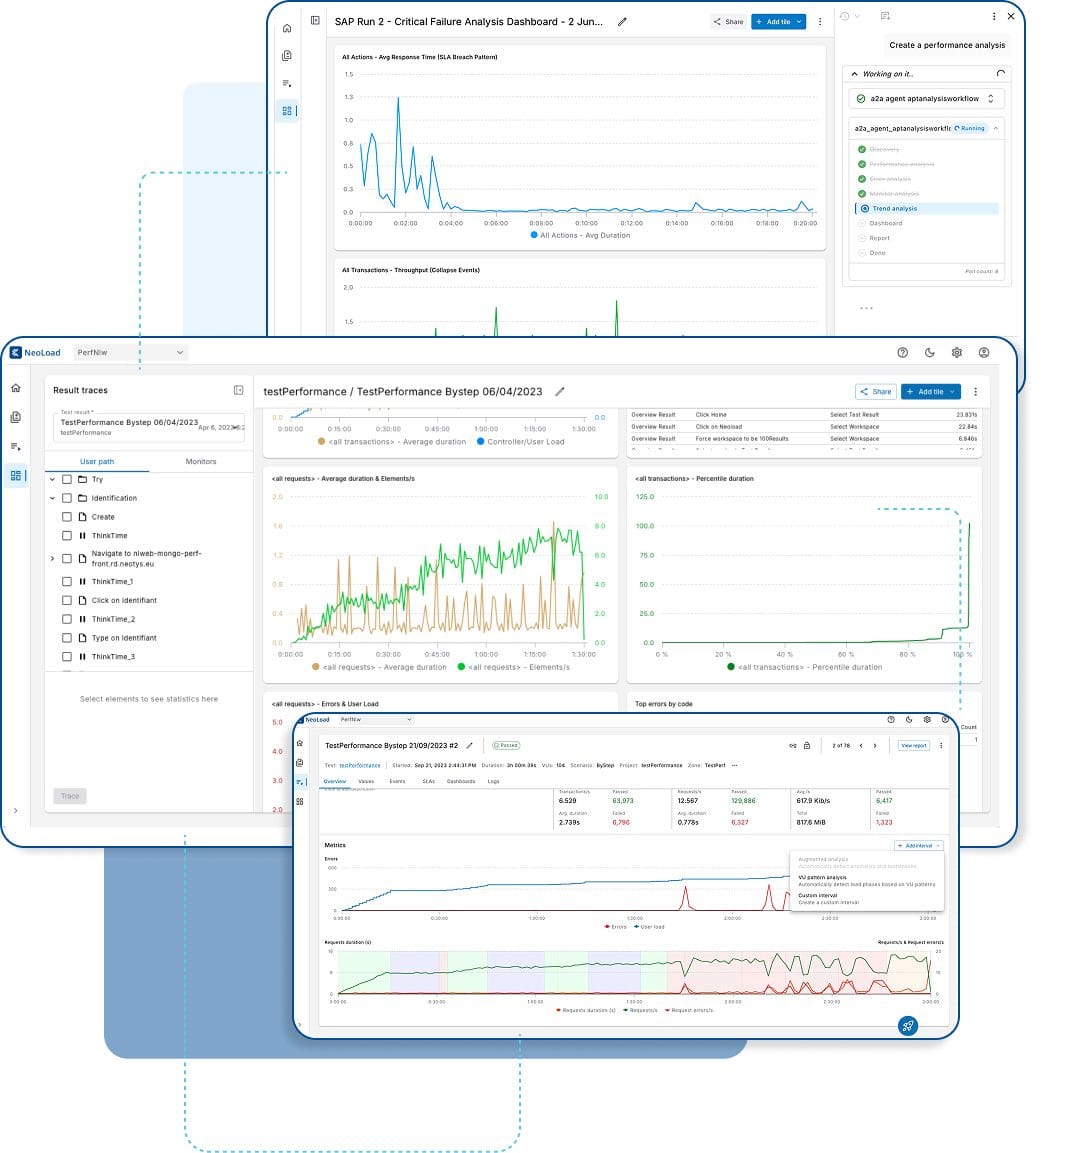
Tricentis NeoLoad — built by Neotys, acquired by Tricentis in 2021 — targets enterprise performance testing with a codeless visual designer plus YAML-as-code authoring and a CLI for pipelines. Its protocol coverage is deep on packaged enterprise apps: SAP (GUI, Fiori, RFC, S/4HANA), Oracle, Salesforce, ServiceNow, Workday, Citrix, real-browser testing, mobile, mainframe, and messaging (JMS, MQTT, Kafka). Load generation runs in the cloud or on-prem. In 2026 Tricentis has leaned into AI positioning, adding chat-driven authoring and MCP integration under an "agentic performance testing" label. There is no public pricing — the calls to action are a free trial and a demo.
Best for: Enterprise and SAP-heavy shops that want codeless authoring plus CI/CD.
Pros
- Codeless visual design plus YAML-as-code serves both non-coders and pipeline engineers.
- Deep enterprise and SAP protocol coverage with automated script maintenance.
- Strong CI/CD and observability integrations, with new 2026 AI and MCP features.
Cons
- No public pricing — enterprise quote only.
- Proprietary and enterprise-oriented; overkill for simple API or web load tests.
- No JavaScript scripting path (YAML or codeless only), which is less appealing to code-first teams.
How to choose
Match the tool to how you work, not to a leaderboard.
- You're a developer or SRE in the Grafana/Prometheus world: start with k6. Test-as-code, a single binary, and native dashboards.
- You want free and GUI-driven, with broad protocols: JMeter. It is the baseline for a reason, and it costs nothing.
- You need maximum throughput from a single load generator: Gatling OSS, moving to Enterprise when you need distributed runs.
- Your team lives in Python: Locust. Full programmability, lightweight, self-hosted.
- You already have OSS scripts and want managed cloud scale without a rewrite: BlazeMeter.
- You test SAP, Citrix, Oracle, or mainframe stacks: LoadRunner or NeoLoad, with NeoLoad the better fit if you want codeless authoring and modern CI/CD.
A reasonable 2026 pattern: prototype and run most HTTP and gRPC tests in k6 or Gatling, keep JMeter for odd protocols, and reserve the enterprise suites for packaged-app and legacy coverage. Wire whichever you pick into your CI/CD pipeline and send results to your observability and APM stack so load tests gate releases instead of running as afterthoughts. Platform teams standardizing tooling across squads often fold the chosen tool into their internal developer platform.
Frequently Asked Questions
What is load testing?
Load testing measures how a system behaves under expected and peak demand by simulating many concurrent users or requests. It records response times, throughput, and error rates as load rises, and identifies the point where performance degrades or the system fails. The goal is to validate capacity and find bottlenecks before real users hit them.
What is load testing in software?
In software, load testing uses a tool to generate synthetic traffic — virtual users or scripted requests — against an application or API, then measures latency, throughput, and errors at each load level. It is a type of performance testing. Teams run it in CI or before releases to confirm the system meets its performance targets under realistic concurrency.
How do you do load testing?
You define a scenario (the user journeys or API calls), choose a tool such as k6, JMeter, or Gatling, script the requests, and set a load profile — how many virtual users, ramped over what time. You run the test against a representative environment, collect metrics, and analyze response times, throughput, and errors to find the breaking point and bottlenecks.
What is the difference between load testing and stress testing?
Load testing checks behavior at expected and peak demand to confirm the system meets its targets. Stress testing deliberately pushes beyond normal capacity to find the breaking point and see how the system fails and recovers. Load testing answers "can we handle the traffic we expect?"; stress testing answers "where and how do we break?"
Which load testing tool is best for beginners?
For beginners who prefer a graphical interface, Apache JMeter is the usual starting point — it is free, GUI-driven, and has extensive tutorials. For those comfortable writing a little JavaScript, Grafana k6 is approachable, well-documented, and installs as a single binary. Both are free to start, so you can trial each against a sample endpoint before committing.
Editor's note — sources: Grafana k6 (k6.io, grafana/k6 on GitHub, Grafana pricing); Apache JMeter (jmeter.apache.org); Gatling (gatling.io, license docs); Locust (locust.io, GitHub); BlazeMeter (pricing); OpenText LoadRunner (opentext.com); Tricentis NeoLoad (product page). Pricing and version details observed October 2026 and subject to change; quote-only products are marked as such. A vendor product image for OpenText LoadRunner was unavailable at publication and is omitted.